
Salt marshes and carbon
Carbon is an essential building block for life, understanding how much carbon is held in soils is important as it will aid our understanding of salt marshes as carbon sinks.
Read more
Science behind the app

The Saltmarsh App was developed to use simple observations of plant communities and soil type to predict carbon stores in English sand Welsh salt marshes.
Read more
Salt marshes and carbon
Carbon-based life
Carbon is a component of every living thing, a building block for life, it is the magic element for everything on Earth.
- Humans are 18 % carbon [1].
- The average plant contains 45 – 50 % carbon [2]
- Soils contain approximately 75 % of the carbon pool on land (4.5 times more than in plants and animals)[3].
- Carbon in carbon dioxide (CO₂) is a small but important part of Earth’s atmosphere[4]
- Plastics and fossil fuels such as oil, petrol, gas and coal contain carbon.
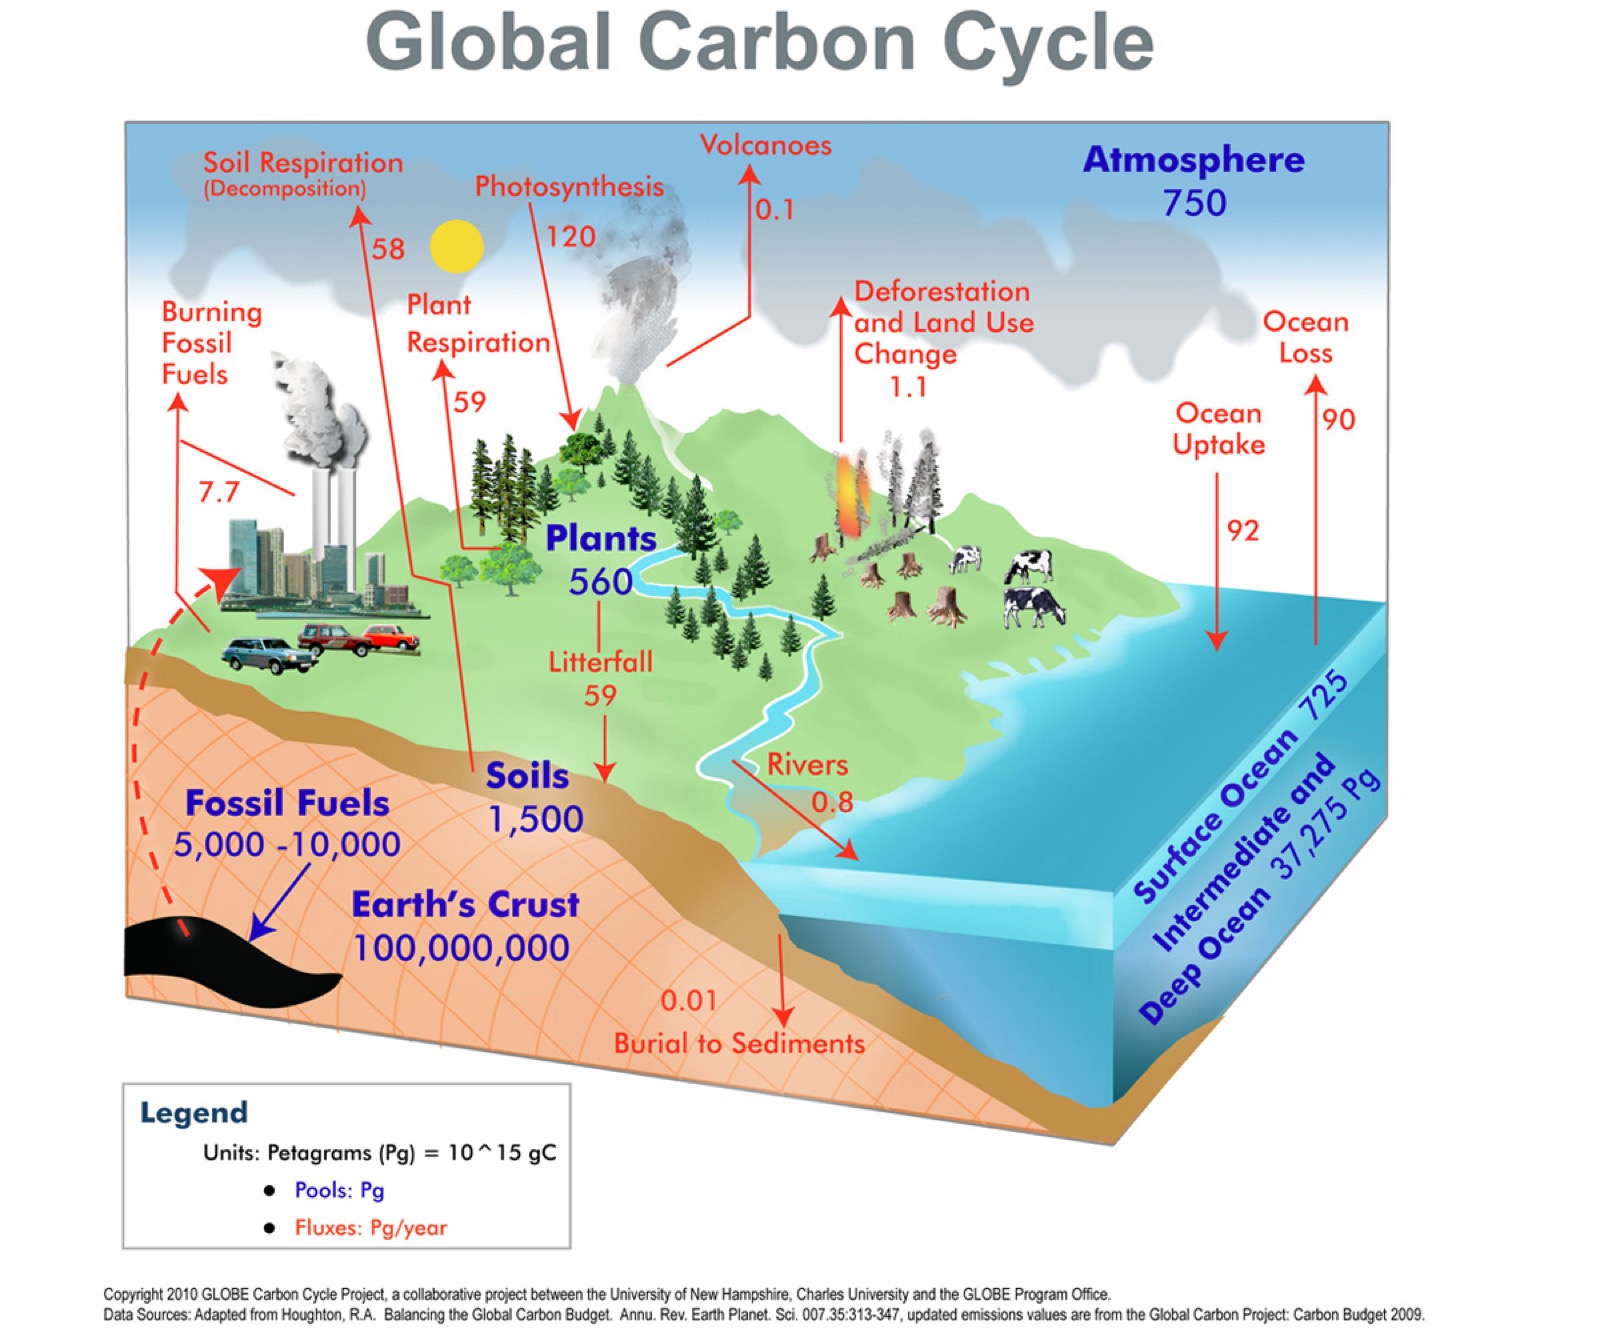
The carbon cycle refers to the continuous movement of carbon, the most abundant element on the planet, through the oceans, land, atmosphere, fossil fuels and all life on Earth.
Climate change and global warming
Carbon dioxide is termed a ‘greenhouse gas’ as it helps keep Earth’s temperature steady, absorbing heat energy and stopping it escaping from the Earth’s surface. However when humans’ burn fossil fuels (coal, oil and natural gas) and cut down and burn trees, CO₂ that had been stored as carbon is released into the atmosphere (about 6 billion tonnes of carbon each year)[5]. This CO₂ accumulates and creates an artificial forcing of the Earth’s temperature called global warming.A temperature rise of just a just a few degrees is very likely to:
- change global weather, increasing the risk of drought and flooding.
- cause the polar ice caps to melt, leading to sea level rise and the risk of flooding and erosion of coastlines and low-lying lands and islands.

Increased flood events as a consequence of climate change.
Carbon in soils
Global warming affects all countries and people in the world. To limit the severity of global warming, we need to limit greenhouse gas emissions. We also need to ensure that CO2 removal from the atmosphere by natural ecosystems* is safeguarded and efficient. Many ecosystems including saltmarshes provide a free carbon storage service and are effective ‘carbon sinks’**. Human changes to land-use and ecosystem extent are the second largest source of human-caused carbon emissions on the planet, following emissions from fossil fuel combustion[6]. Understanding how much carbon is held in ecosystems and soils is important because then we can protect the important carbon-storing areas. Saltmarshes and other vegetated coastal ecosystems (mangroves and seagrass beds) are extremely important ‘blue carbon’ stores and damage to these ecosystems through changes in land-use could have an estimated cost of up to $US 42 billion dollars annually[7]. Yet currently we do not know enough about which marshes are important and what role they have to play. If we know how much carbon is held in saltmarsh soils we can better understand its role as a carbon sink, and so preserve and protect this fragile and important ecosystem.
*Ecosystem: according to the Millennium Ecosystem Assessment [8] this is a term to describe the plants, animals and organisms that interact with each other and with the wider environment (weather, earth, sun, soil, climate and atmosphere) in a particular place. Humans are an integral part of ecosystems. Ecosystems vary enormously in size; a temporary pond in a tree hollow and an ocean basin can both be ecosystems.
**Carbon sinks: large systems (oceans, forests and soils) that help reduce the warming effect of greenhouse gases by absorbing roughly half of the carbon dioxide that humans emit into the atmosphere each year. The concept of carbon sinks is based on the natural ability of trees, other plants and soils to soak up CO₂ and temporarily store the carbon in wood, roots, leaves and the soil.
Reference list
[1] http://cnx.org/contents/FPtK1zmh@6.27:uC1BEgbn@4/Elements-and-Atoms-The-Buildin
[2] Schlesinger, W.H. (1991) Biogeochemistry, an Analysis of Global Change. New York, USA, Academic Press.
[3] Lal, R. (2004) Soil carbon sequestration impact on global climate change and food security. Science 304, 1623-1627.
[4] http://www.esa.org/esa/wp-content/uploads/2012/12/carbonsequestrationinsoils.pdf
[5] FAO (2003). Instruments related to the United Nations Framework Convention on Climate Change and their potential for sustainable forest management in Africa. Document prepared by Alain Karsenty, Cécile Blanco, Thomas Dufour CIRAD-Forêt, Paris, France, Working Paper Y9704E. FAO, Rome. ftp://ftp.fao.org/docrep/fao/011/ac836e/ac836e00.pdf
[6] IPCC (2014). Climate Change 2014: Mitigation of Climate Change. Contribution of Working Group III to the Fifth Assessment Report of the Intergovernmental Panel on Climate Change [Edenhofer, O., R. Pichs-Madruga, Y. Sokona, E. Farahani, S. Kadner, K. Seyboth, A. Adler, I. Baum, S. Brunner, P. Eickemeier, B. Kriemann, J. Savolainen, S. Schlömer, C. von Stechow, T. Zwickel and J.C. Minx (eds.)]. Cambridge University Press, Cambridge, United Kingdom and New York, NY, USA.
[7] Pendleton, L., Donato, D.C., Murray, B.C., Crooks, S., Jenkins, W.A., Sifleet, S., Craft, C., Fourqurean, J.W., Kauffman, J.B., Marbà, N., Megonigal, P., Pidgeon, E., Herr, D., Gordon, D and Baldera, A. (2012) Estimating Global “Blue Carbon” Emissions from Conversion and Degradation of Vegetated Coastal Ecosystems. PLoS ONE 7 (9): 1-7
[8] Millennium Ecosystem Assessment (2005) Ecosystems and Human Well-being: A Framework for Assessment. Island Press, London pp4. http://www.millenniumassessment.org/documents/document.48.aspx.pdf
Science
Over the past centuries and decades many species have become rare or extinct from over-hunting, excessive use of natural resources or the loss of natural habitat. There are indications that a reduction in the diversity of life (biodiversity) leads to a reduction in the benefits we get from nature; benefits such as clean drinking water and food. In science, we call these benefits ‘ecosystem services’, to mean services that nature provides to people [1]. Saltmarsh ecosystem services include providing natural protection against coastal floods and waves, removing carbon from the atmosphere (carbon sequestration) that reduces the risk of climate change, preventing coastal pollution and providing space for recreation.In the CBESS project (Coastal Biodiversity and Ecosystem Services Sustainability) we investigated how saltmarsh benefits are linked to biodiversity. We focused on a great variety of biodiversity groups, including animals, plants and microbes. Fieldwork was carried out in two of the most important saltmarsh regions in England: Morecambe Bay in the north-west and Essex in the south-east. You can learn more about or work at the CBESS website.

Figure 1. Collecting samples from Warton Marsh in Morecambe Bay; February 2013. One researcher is hammering a corer into the ground to extract soil for analysis in the laboratory. Soil samples gave us information on carbon stock, soil type, soil chemistry and plant roots.
During our research we spotted relationships between the ecosystem services measured and components of the biodiversity observed. In particular, we noticed that some plant communities (groups of different plants) seemed to have more carbon in the soil than others. That made us think: can we predict how much carbon is in the soil (carbon stock) just by observing what types of vegetation a marsh has? Observing vegetation is a lot easier and quicker than digging holes and making laboratory analyses (see Figure 1). Predictions done from vegetation composition would be useful to coastal managers within environmental agencies, who want to know how much carbon there is in marshes, but, who do not want to take lots of time processing samples of saltmarsh soils. Of course, the same vegetation type might have very different carbon stocks, depending on the environment in which it grows. Growing in a sandy and salty soil is a lot tougher for a plant than growing in a fine-grained soil with no salt. Consequently, we probably needed to have information on both the vegetation type and the environmental setting in which it grew, before we could make good predictions of carbon stock. We decided to put these ideas to the test. Our approach is summarised below. For full details of methods and analyses, please download the PDF report on the saltmarsh carbon tool.
We went to Wales and sampled 23 salt marshes during the summer of 2015 (Figure 2). The surveys were carefully designed to produce information which would help highlight the link between saltmarsh vegetation and carbon stock. We sampled mainly the mid to high salt marsh. Plant communities were identified according to the national vegetation classification scheme (NVC) (Figure 3). Carbon stock in the soil was measured from extracted cores (Figure 1). To test which predictors of carbon stock were best, we collected data on plant diversity, plant height and the weight of roots, and sampled a variety of indicators of environmental setting: soil pH, soil bulk density (the volume-specific weight of soil), soil organic matter, soil grain size (coarse and sandy to fine and clay-rich) and soil type, amongst other things.

Figure 2. The 23 Welsh salt marshes sampled, in order to develop the Saltmarsh App.

Figure 3. An example map of the distribution of four key salt marsh plant NVC (National Vegetation Classification) community types and their NVC code: SM14, SM15, etc) in the Black Scar salt marsh in south-west Wales. We chose to concentrate on these four types in the Saltmarsh App, as they were the most common plant communities encountered in Morecambe Bay and Essex and represented nearly half of all marsh areas in Wales.
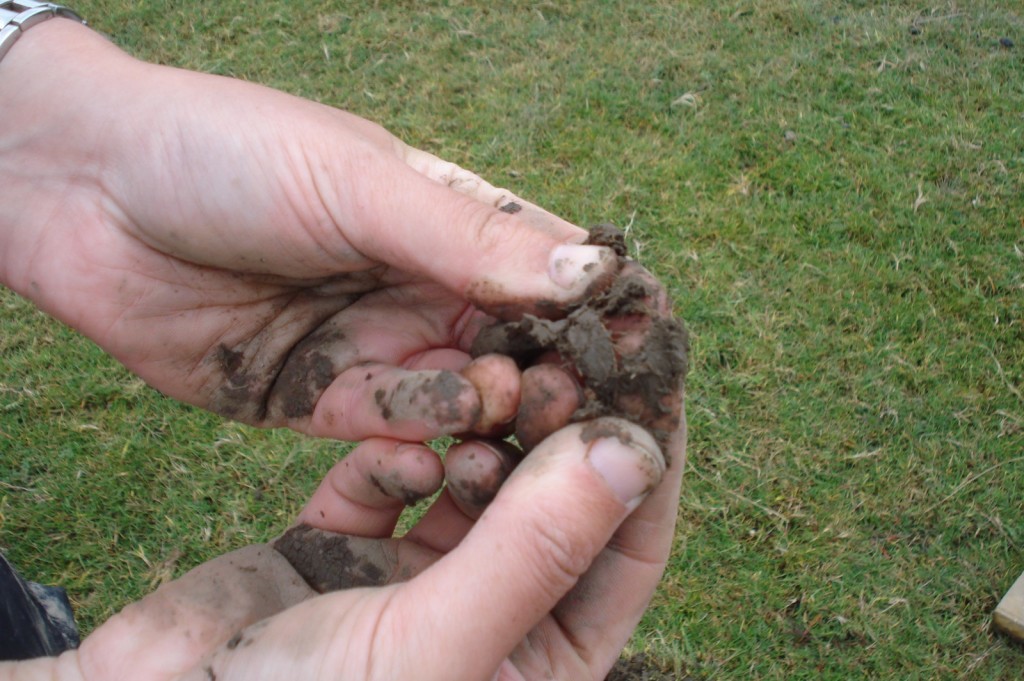
Our results confirmed that carbon stock had a clear relationship with plant and soil types. By the use of some simple information on vegetation community type – specifically, classifying vegetation into four different types by their dominant plant species: Sea Purslane (Atriplex portulacoides), Common Saltmarsh Grass (Puccinellia maritima), Saltmarsh Rush (Juncus gerardii) and Sea Rush (Juncus maritimus) (Figure 3) – we could predict 40-50% of the spatial variation of carbon stock in the soil. Equally, a simple classification of the soil into 3 key soil types gave us 40-50% prediction of carbon stock. The soil types were: organic soil, sandy soil and clay-silt soil. Classifying the soil into these three types was simple and based on approaches developed by the US Department of Agriculture [3]: make an assessment of sediment coarseness based on a set of touch-related criteria, and combine this with a simple ‘roll test’ (Figure 4). Once we had information on both the vegetation type and the soil type, we could predict carbon stock quite accurately, and account for up to 60% of the spatial variation in carbon.


Figure 4. The soil roll test; taking a soil sample and attempting to roll it into a worm will give an indication of soil type. If you roll a silvery looking ‘worm’ more than 3 mm wide, that breaks apart easily, it is likely to be a sandy soil. A ‘worm’ 3 mm wide or less that holds together well would suggest a clay-silt soil. If the soil contains more than 30% dead plant material and roots it is organic and no roll test is needed.
To test how good our predictive models were, we compared them to actual observations of carbon stock taken in the salt marsh. The accuracy of the predictions was good and can be seen in Figure 5. Confirming that carbon stock can be predicted from simple observations of vegetation types is in agreement with an increasing amount of scientific evidence, which shows that species and natural communities have ‘traits’ (a particular characteristic or role of a species, related to what it does to its environment) for delivering ecosystem services [2]. This body of work, and our research, together confirm the prediction that the benefits we get from nature are linked to the natural variety of life. We have since demonstrated similar relationships for other ecosystem services. For instance, plants protect against soil erosion, and in salt marshes we have found that marshes with greater variety of plant species offer more effective erosion protection erosion than marshes with a low variety of plants (Ford et al 2016) [4].

As well as using our research to develop The Saltmarsh App we have also made a predictive tool for use by specialist environmental organisations. That tool includes detailed maps of predicted carbon stocks in salt marshes (Figure 6). The tool and the maps can be downloaded as a pdf and GIS layer at [url TBC]. It is hoped that the App and the predictive tool will increase the general publics and environmental mangers understanding of the importance of biodiversity to the benefits we all get from our natural environment.

References
[1] https://www.gov.uk/government/uploads/system/uploads/attachment_data/file/191502/Introductory_guide_to_valuing_ecosystem_services.pdf.
[2] Lavorel, S. and Garnier, E. (2002) Predicting changes in community composition and ecosystem functioning from plant traits: revisiting the holy grail. Functional Ecology 16, 545 -556
[3] United States Department of Agriculture (USDA) July (2001) Soil Quality Test Kit SECTION II Background & Interpretive Guide for Individual Tests. Agricultural Research Service, Natural Resources Conservation Service, Soil Quality Institute pp 77 http://www.nrcs.usda.gov/Internet/FSE_DOCUMENTS/nrcs142p2_052490.pdf
[4] Ford, H., Garbutt, A., Ladd, C., Malarkey, J., and Skov, M.W. (2016) Soil stabilization linked to plant diversity and environmental context in coastal wetlands. Journal of Vegetation Science 27, 259-268
http://onlinelibrary.wiley.com/doi/10.1111/jvs.12367/pdf